
These Global Cities Show the Highest Real Estate Bubble Risk
Housing bubbles are a tricky phenomenon. As a market gathers steam and prices increase, it remains a matter of debate whether that market is overvalued and flooded with speculation, or it’s simply experiencing robust demand.
Of course, once a bubble bursts, it’s all obvious in hindsight.
One common red flag is when prices decouple from local incomes and rents. As well, imbalances in the real economy, such as excessive construction activity and lending can signal a bubble in the making.
The map above, based on data from the Real Estate Bubble Index by UBS, examines 25 global cities, scoring them based on their bubble risk.
Overinflated Markets
In the 2022 edition of the Real Estate Bubble Index, nine of the cities covered were classified as having extreme bubble risk (1.5 or higher score).
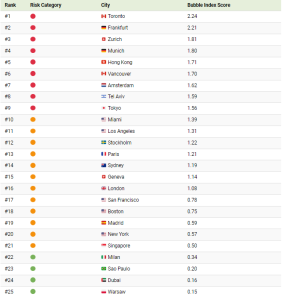
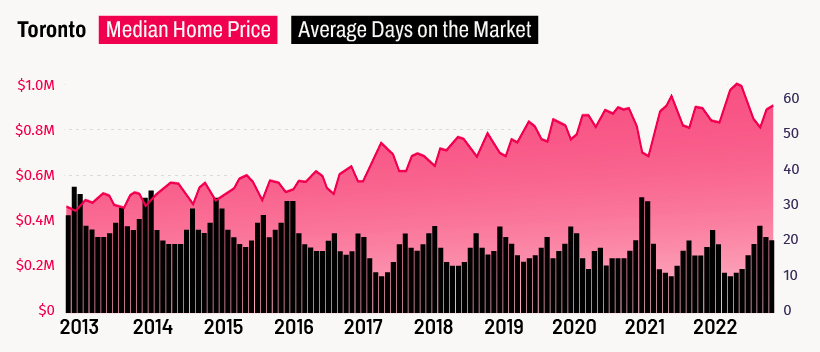
Canada’s largest city finds itself at the top of a ranking no city wants to end up on. Toronto’s home prices have been rising steadily for years now, and many, including UBS, believe that the city is now firmly in bubble territory.
Vancouver also finds itself in a similar position. Both Canadian cities have a high quality of life and have thriving tech industries.
Notably, none of the U.S. cities analyzed find themselves in the most extreme bubble risk category. The closest scoring U.S. city was Miami, which sits firmly in overvalued territory (0.5-1.5 range) with a score of 1.39.
Examining the Trends
In recent years, low interest rates helped push home prices and incomes further apart.
For cities in the bubble risk zone, prices have climbed by an average of 60% in inflation-adjusted terms over the past decade, while rents and real incomes increased by just 12%. And, while COVID-19 briefly put a dent in urban demand, rents in the cities analyzed rose at around the same pace as pre-pandemic times.
As a result, all but three of the cities saw positive price growth over the past year from a nominal price perspective:
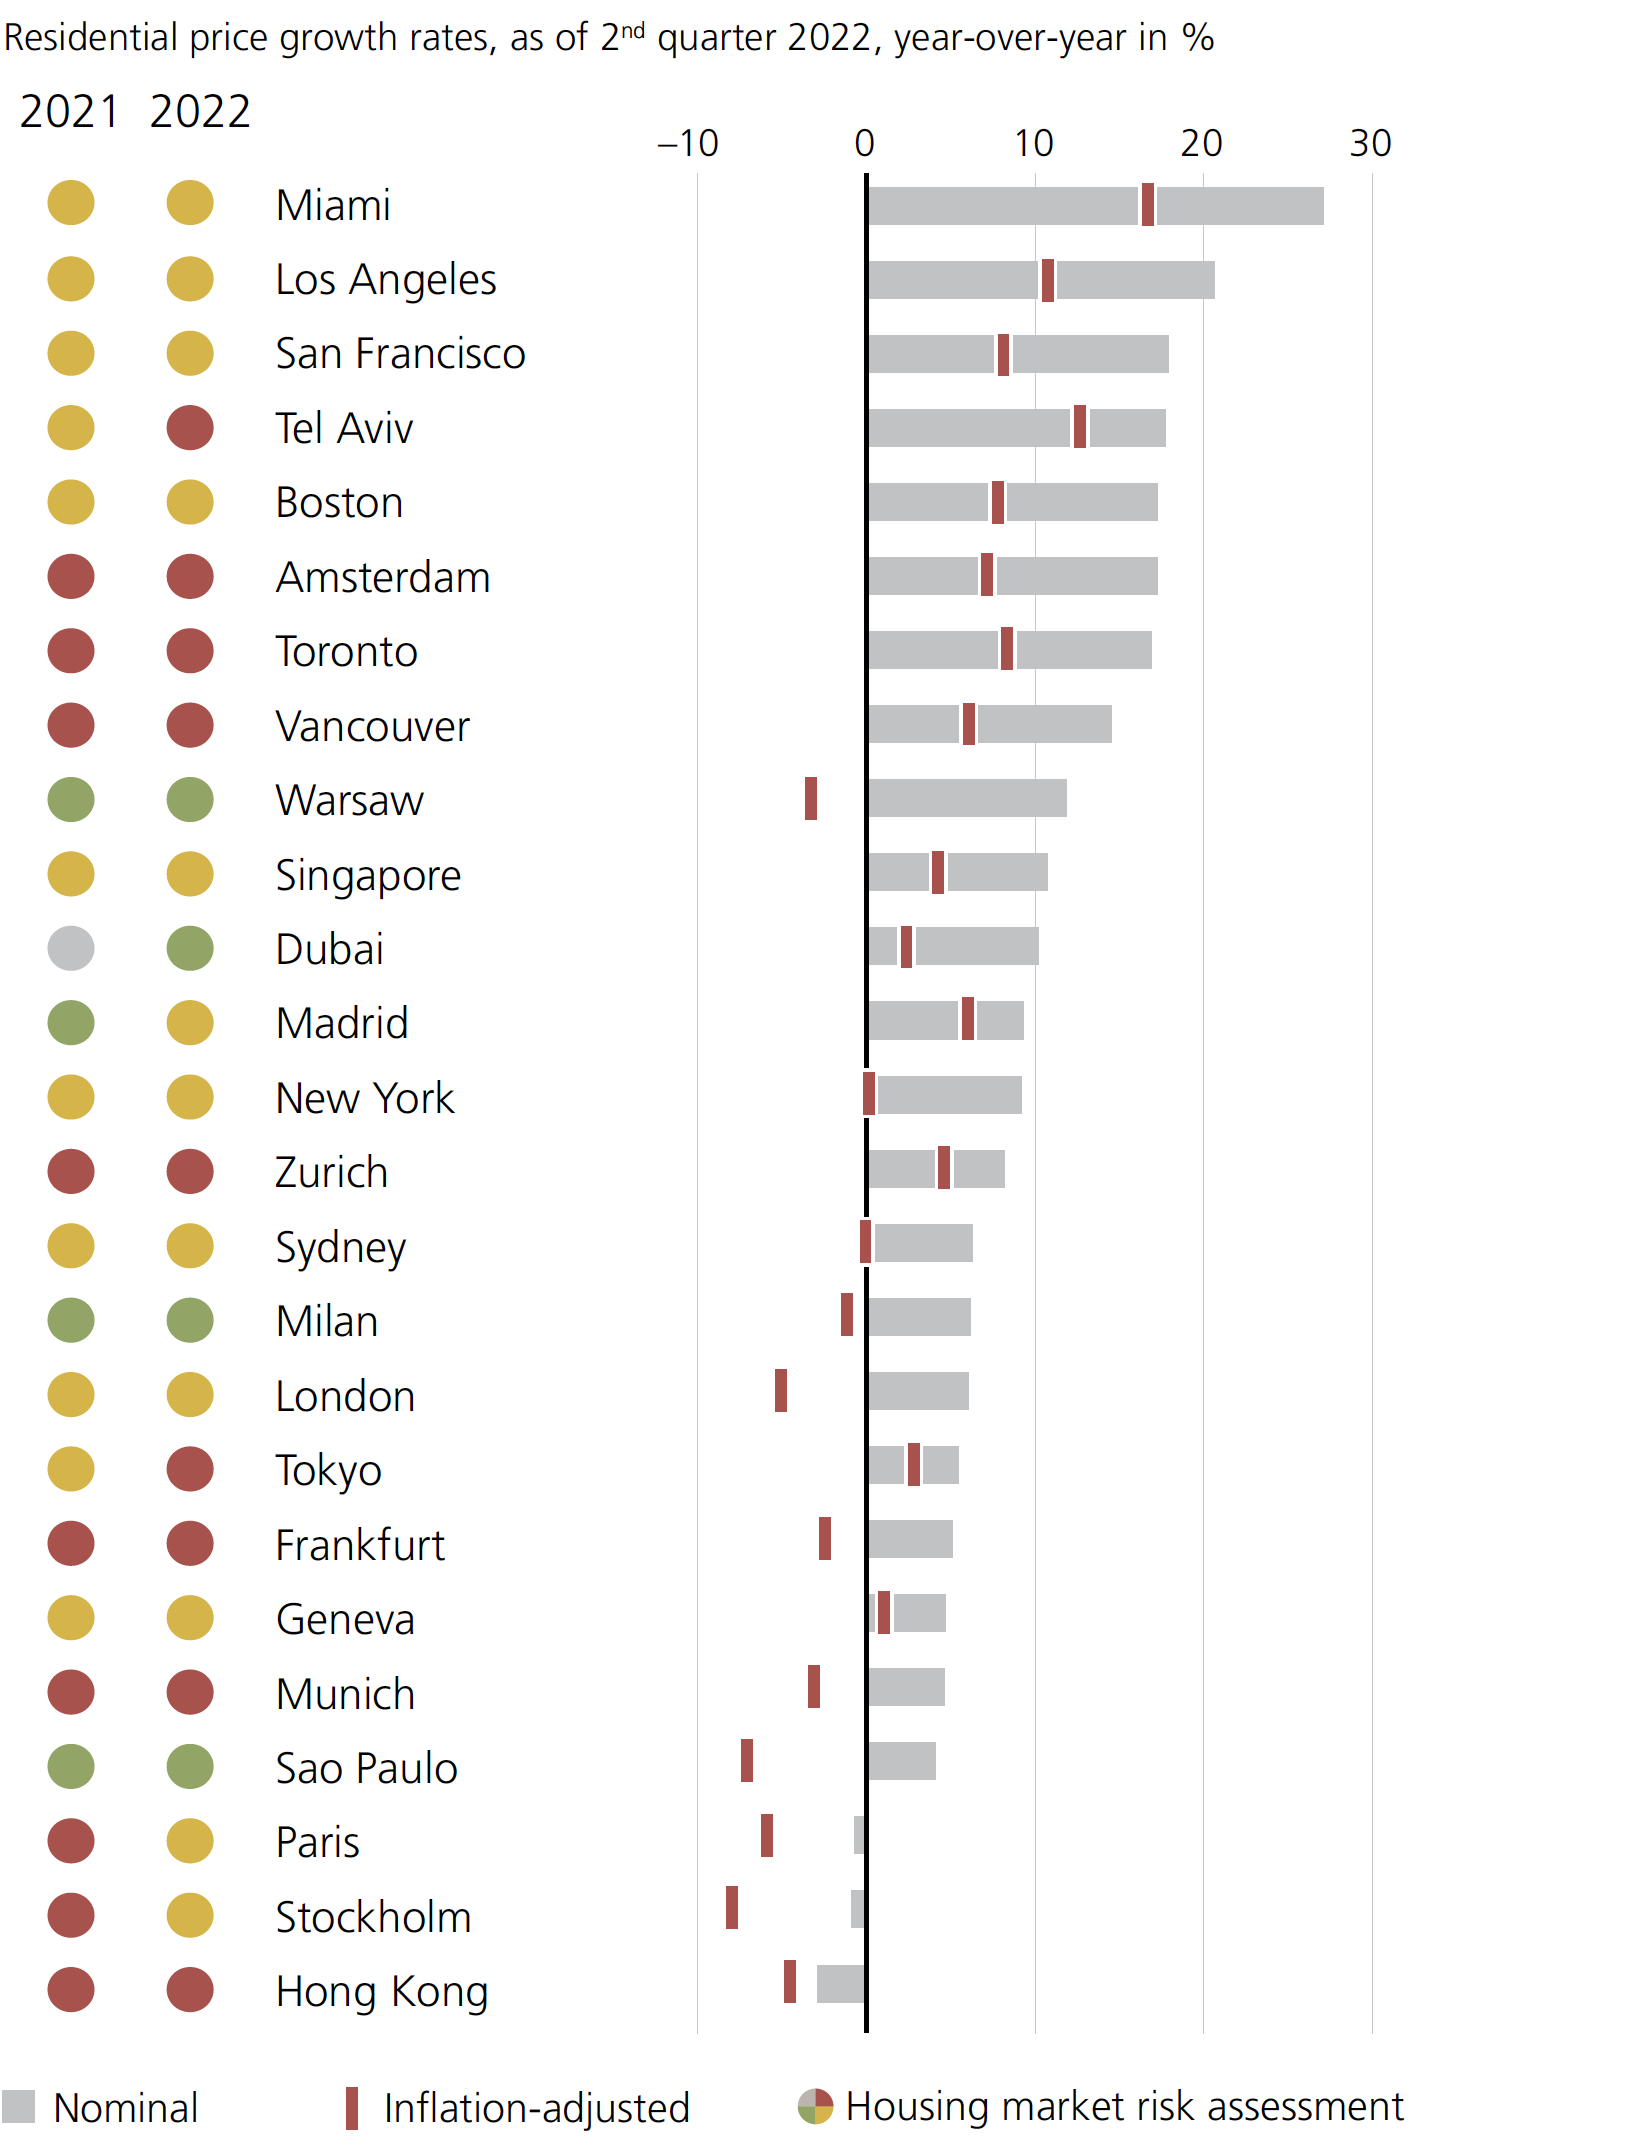
U.S. cities occupy a number of spots at the top of this chart. Miami, in particular, is seeing strong internal migration patterns, as well as renewed interest from foreign investors.
Hong Kong experienced the biggest one-year nominal drop of all the cities analyzed. The report notes that since around 2019 Hong Kong “has broadly stagnated as the lack of affordability, economic woes, and pandemic restrictions all took a major toll on demand.”
Prices can’t rise forever. According to UBS, most cities with high valuations, price corrections have already begun, or could be right around the corner.